For most teachers, the starting point is the main video. It contains a lot of information and time to reflect, revisit sections and ask questions can form the basis of a class discussion. The comprehension can further be used to review understanding of some of the key points.
Artefact Activities
The artefact for this section is a railway timetable from the 1840’s . The railway was well established by this time and had already extended beyond the original route. You can see the different towns mentioned. Can the children use a map to identify the places and draw the possible routes? There is a blank map below to record their ideas, a map app will help them locate the towns.
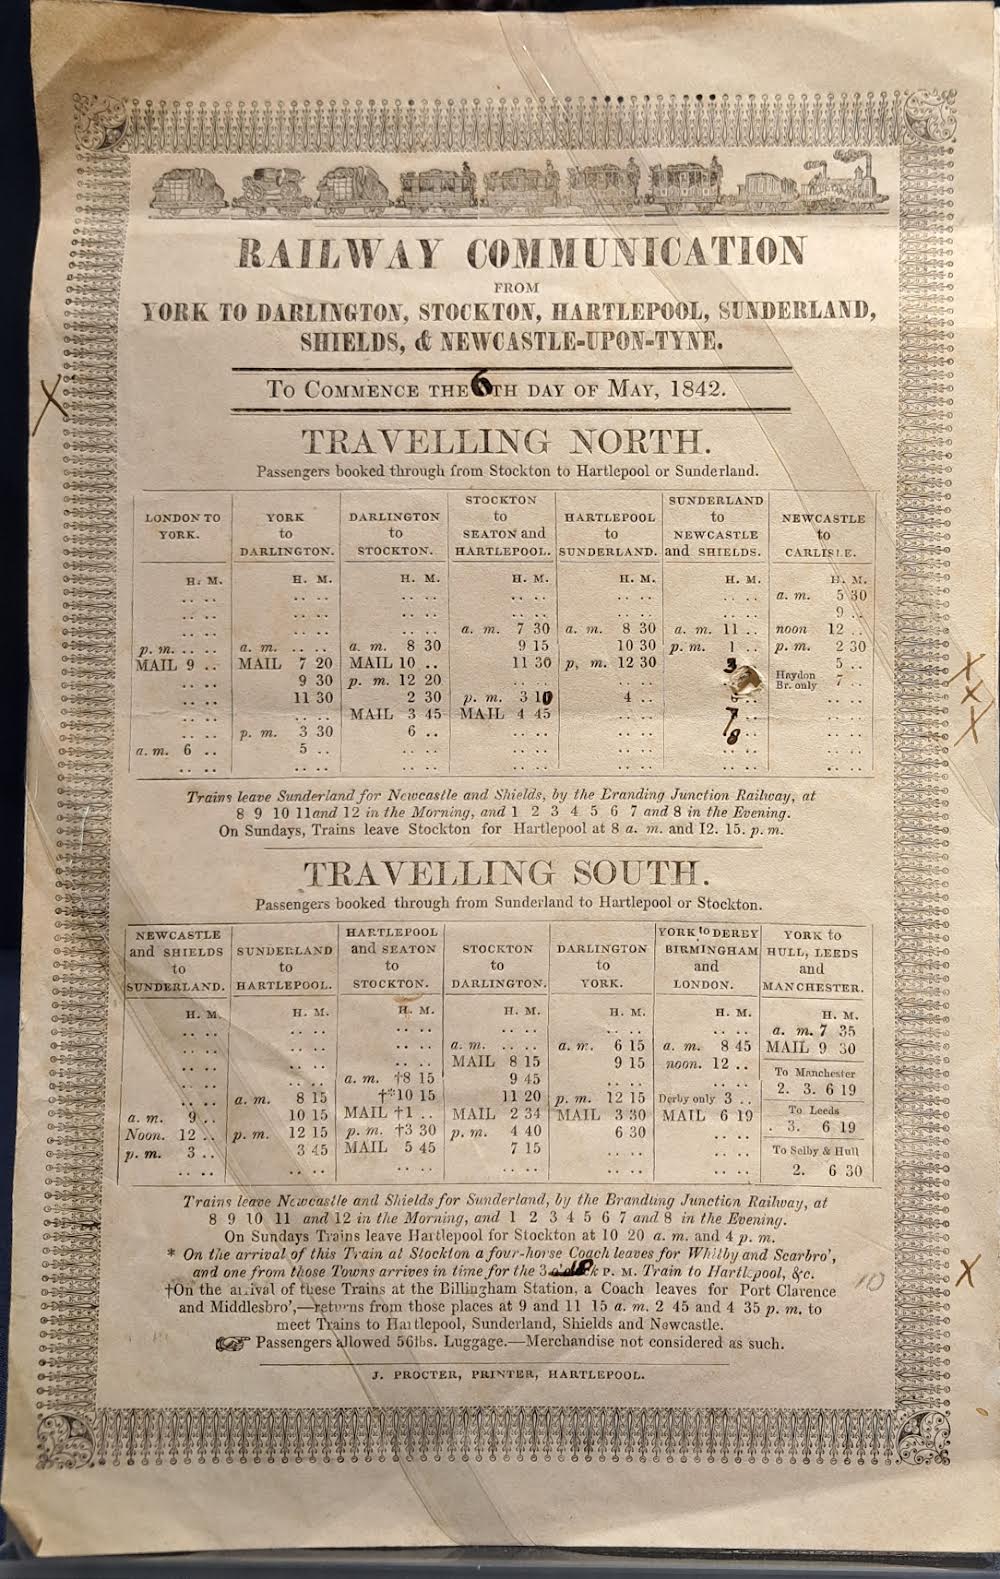
Original timetable image

Simple map of UK (PDF)
Digital Skills Task
This task uses information from the first few months of the railway to look at trends in data. Ideally the task can be done in Numbers on an iPad to allow children to easily look at different types of chart as well as recording their own ideas alongside the data. However, there are also Excel versions that offer a simplified activity. Support for using Numbers can be accessed by clicking the image below.


Coal tonnage on SDR with chart (Numbers)
Coal tonnage on SDR without chart (Numbers)
Coal tonnage on SDR just data (Excel)
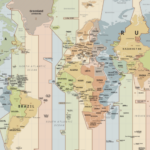
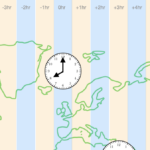
Other Curriculum – Geography/Science/Maths – different time zones
The railways changed many things in society but perhaps one of the most fundamental was the standardisation of time. Although this happened gradually with the UK (until an Act of Parliament), it also formed the basis for international time. The activity below focusses on understanding how time differs longitudinally. It is a simplified version of the actual time zone markers but a link to the ‘real zones’ is also provided. There is also a link to. ashort video about why time zones exist.
Time zones task (Pages)
Time zones task (PDF)